inside job: a documentary film
For this assignment, my teacher, Mr. Chin had the class watch a documentary called, "Inside Job". The class was asked to watch the film and take notes on each section (the film had six sections) . After watching the film, the class was asked to write a reflection/ summary. The steps to this assignment was to watch the film and listen carefully to what the economists had to say. I also took notes on important events that happened to our economy. This assignment was important to me because it taught me many things that happened to our economy that I did not know about. It taught me what the economists and top CEOs of big companies did with our money and why our economy was in a recession. Learning about our economy made it meaningful to me because now I have a better understanding of what our economy is like. After watching the documentary, I now know that CEOs of big banking companies bet against bad CDOs (collateralized debt obligation) in order for them to gain money for themselves.

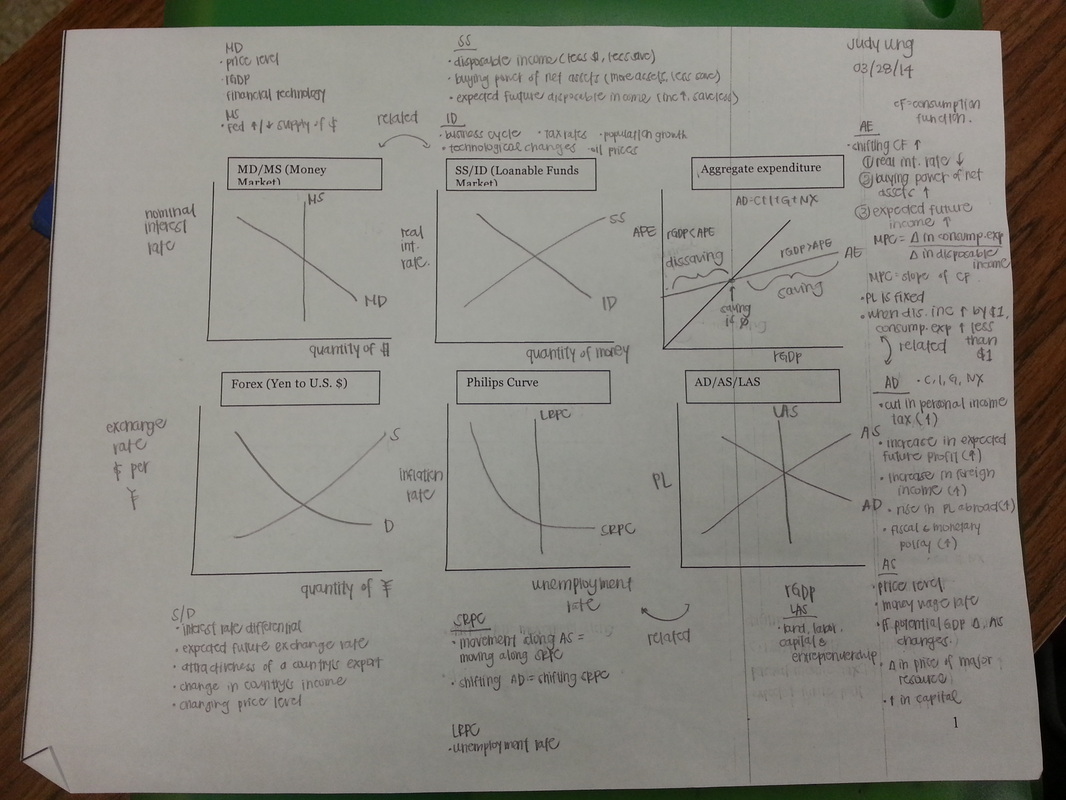
review worksheet: prepping for Ap exam
In this assignment, Mr. Chin gave the class a worksheet. This worksheet is for us the make notes on the graphs that will be on the AP Macroeconomics exam. In this worksheet, we were assigned to label the graphs carefully and draw the correct curve. We first labeled and drew the curves on our own. After ten minutes of trying to remember how each graph looked like, we used our books, notebook, and notes to refer to the graphs. This assignment was important to me because it helped me remember how each graph looked like. After learning about so many things about macroeconomics, there's so much to remember and this worksheet made it easier. The worksheet given to me made it meaningful because as the AP exam is getting closer and closer, there's so much to study for and this worksheet simplified what I needed to study for. Before completing this worksheet, I hardly remembered how any of the graphs looked like. After completing the graph, I now know what the money demand/ money supply graph, supply saving & investment demand graph, and many more graphs look like.